
Accurate and timely reporting is an essential for any learning management system. LMS reports help ensure compliance with security, safety, ethical and transparency requirements, as well as identify gaps and opportunities for learner development and support.
Which is why we’ve introduced some major improvements to the report builder across Totara 13. Get the lowdown below, and then head to the Totara Help site to access our latest Totara Learn reporting documentation.
Viewing reports
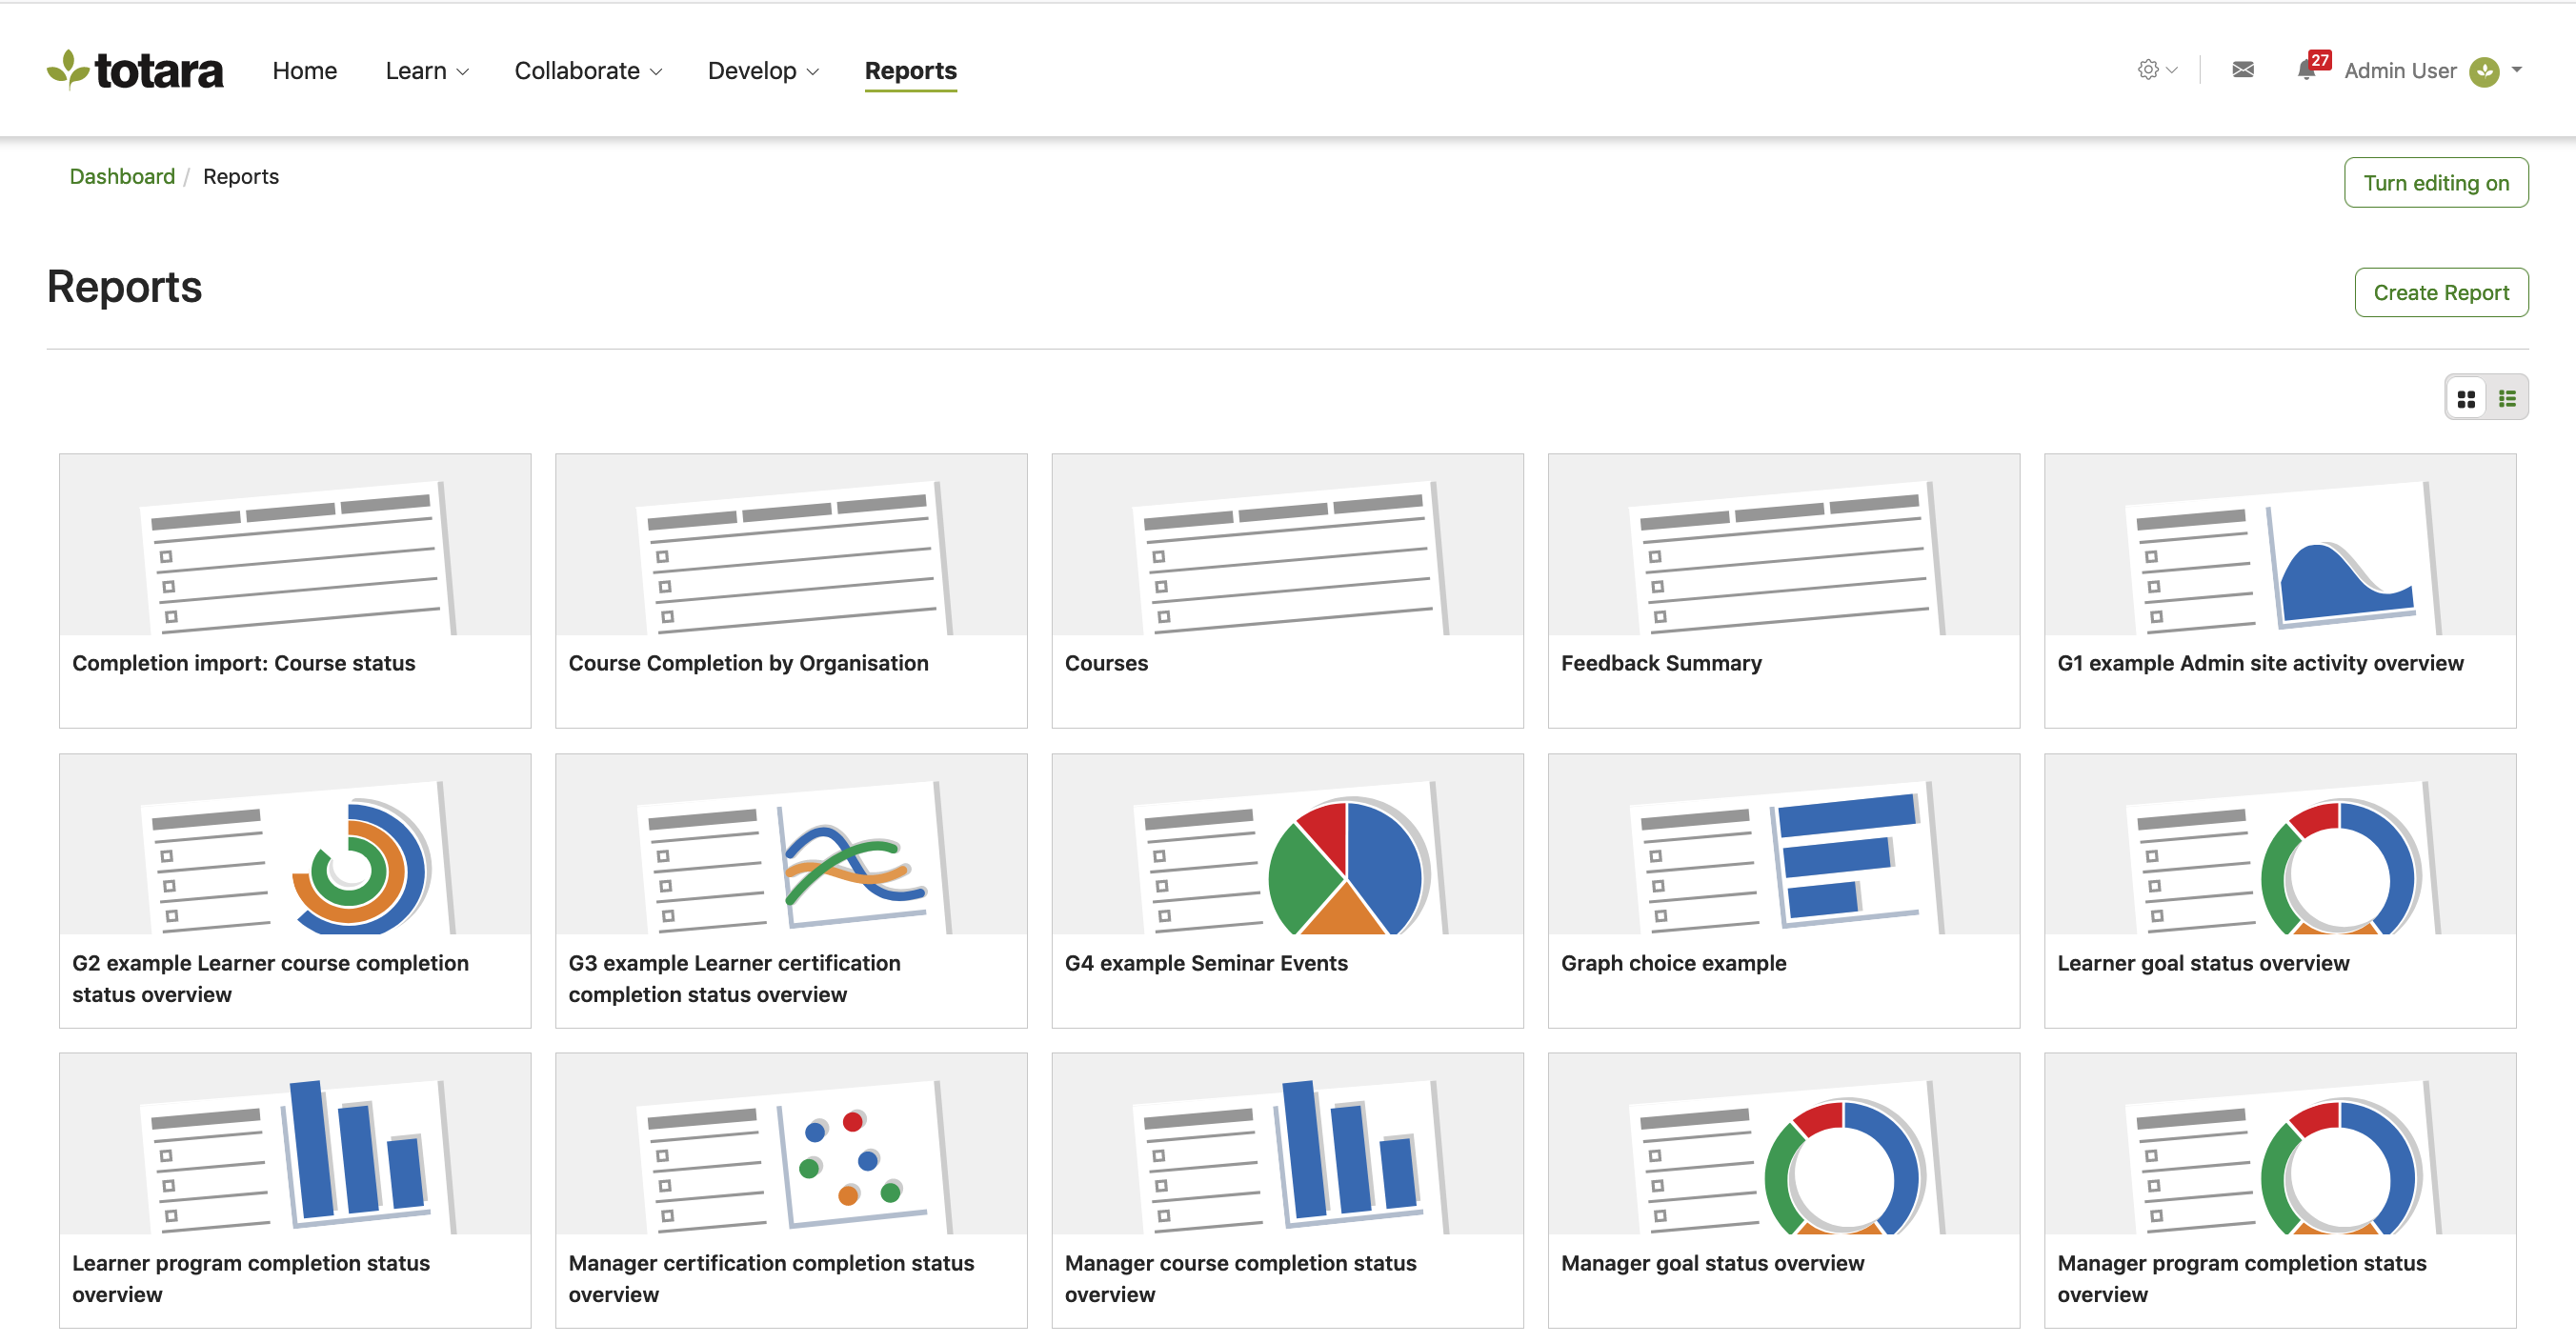
You can now review and launch all the reports you’ve created or that have been shared with you from a graphical tiled-based view, similar to the learning catalog.
Report tiles can show the description or abstract of the report and indicate the type of graph included within the report.
We’ve also added to the saved search feature and you can now set a default saved search – meaning you can view a report pre-filtered with your preferred data restrictions.
Creating reports
With so much data captured and available within your Totara site, we’ve been working on ways to help you quickly and painlessly create reports.
If you have access to build reports, you can now jump straight to the report builder from your view reports page.
We’ve revamped the create report page which now offers a new search, report source filter and preview of all the reports you can create and customize. With report templates and a new create and view option, you can quickly spin up new reports and make the required column, filter and user content filters as required.

Graphical reporting
We have also introduced a new graphical reporting tool – ChartJS – that not only improves and modernizes the graphs you can generate to accompany your reports, but offers some new report types.
We now have donut and progress donut graphs to add to the existing options of pie, horizontal bar, line, area, column and scatter displays.
Graphical displays not only make large amounts of data easier to understand and assess, it provides an at-a-glance summary of progress, status, dates and numbers. These graphs are particularly powerful when used in combination with the Dashboards functionality where different types of users across your site can be provided quick and digestible access to the most relevant information.

Last Updated
02/08/2024
Article Type
Blog
Solutions
Learn